What's the Deal With Yield Inversion?
Table of Contents
You may occasionally hear about “yield inversion”, which is usually referring to the difference in yield between the 10 year and the 2 year US government treasury bonds. This number often gets mentioned in the news because when the value goes negative, it’s often interpreted as a sign that we’re either in a recession, or about to be in a recession.
Let’s try to understand what’s going on here. The term yield is used to refer to the current market yield rate for a bond of a specific maturity. The 10 and 2 year yields are some of the most popular ones, but bonds come in all kinds of maturities. US treasury bonds in particular come in all kinds of shapes and sizes, but often cited are the 3 month, 2 year, 10 year, 20 year, and 30 year treasuries. The yields on these bonds are often interpreted as signals about future economic policies.
Wikipedia has a good run-down of all the different kinds of bonds issued by the US federal government. There are also municipal bonds, corporate bonds, and lots of other different bonds.
In general terms, the main components of any bond are as follows:
- The principal, which is the face-value of the bond (i.e., $100).
- A maturity, which is the date on which the bond expires and the issuer has to repay the principal.
- A coupon, which is the interest a bond issuer pays the holder for the bond.
- The yield, which is the effective interest rate the bond pays if you buy it today and hold it till maturity, which can fluctuate as bonds are bought and sold with varying maturities at prices at, above, or below their face value.
There are some other important details, but those are the most important things. If you buy a bond, you are a bond holder, and the seller (or issuer) is indebted to you. Buying a bond is the opposite of taking out a loan, except when you buy a bond it’s like you’re the bank, and the government (assuming you buy a government bond) is borrowing money from you.
Most government bonds are sold at auction, and their value is determined by market participants. The interest rates paid on the bonds are determined at the time of their issuance, which fluctuates based on the interest rates set by the central bank.
You can also buy bonds directly from the US treasury, but this is generally not how you get the best price on them. For example, you can buy a 2 year note paying 2.75% from TreasuryDirect for $100, but if you instead buy the same bond from public markets you can get a yield of 4.127% as of the time of writing. Because of these spreads, buying and selling bonds on open markets is a huge business.
How Is Yield Determined #
Okay so let’s talk about that yield word some more: what exactly is the yield? It’s fairly simple: if you buy a 10 year bond from TreasuryDirect, it will cost you $100 and pay a coupon of 2.75% per year. The 2.75% number is not the yield, because if you were to turn around and sell that same bond you will not receive $100 for it on the open market, because the market will discount the face value.
Calculating the yield \(Y\) of a bond is pretty simple. All you do is take the annual coupon payment, \(C_{payment}\), and divide that by the current market price, \(P_{market}\):
$$ Y = \dfrac{C_{payment}}{P_{market}} $$
It’s important to note that the yield of a bond is inversely proportional to the market price of that bond. The coupon payment is fixed for the entire duration of the bond, so as the price of a bond goes down, the yield goes up, and vice versa.
In the case of the 10 year treasuries, they pay 2.75% twice a year, which works out to 2 payments of $1.375. Now, as I said, if you buy a 10 year treasury directly from the government today, you won’t be able to sell it for the $100 you paid. We can work out what you’d get for it by taking the current yield (which is 4.127%) and working backwards:
$$ P_{market} = \dfrac{\$2.75}{4.127\%} $$
Which works out to:
$$ P_{market} = \$66.63 $$
Yikes! So if you pay $100 for a 10 year bond today, and try to turn around and sell it tomorrow, you’ll only get about $66 for it. Of course, people don’t typically do this, unless they plan on holding the bond all the way to maturity. If you did that, then you’d eventually receive the full face value plus all the coupon payments over 10 years, which can be calculated with:
$$ V_{present} = V_{face} + C_{payment} \times n_{periods} $$
Where \(V_{present}\) is the present value, which is also the total value at maturity, \(C_{payment}\) is the amount of each coupon payment, and \(n_{periods}\) is the total number of payment periods. Plugging in the values for the 10 year treasury we get:
$$ V_{present} = \$100 + \$1.375 \times 20 $$
Which works out to:
$$ V_{present} = \$127.5 $$
Now, if you dig into the details on the TreasuryDirect website, you can find the details for the auctions which happen periodically. The most recent auction for the 10 year note can be found here, which shows the following results:
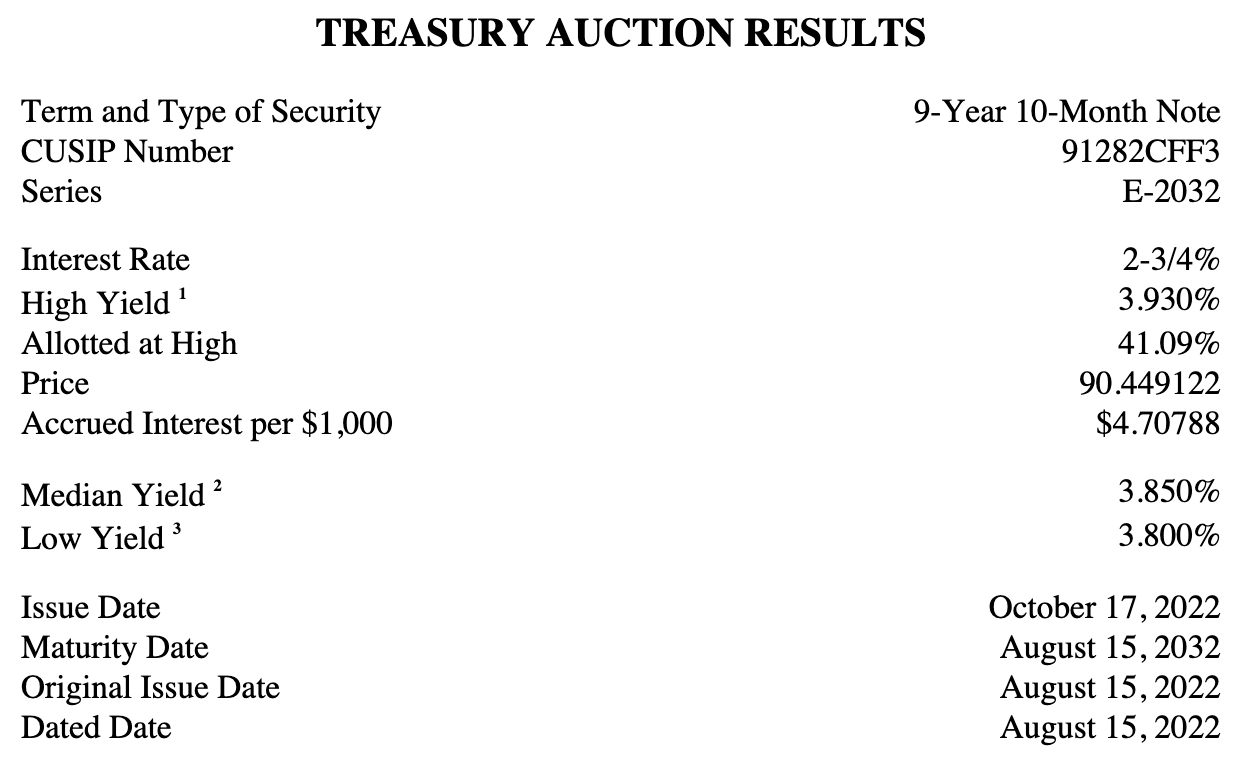
Interestingly, we can see that the market paid the government $90.45 for bonds yielding 2.75% on $100 maturing in 10 years. That yield works out to about 3.85%, as noted in the auction results.
In other words, you could have bought $100 worth of debt from the US government for $90.45, and for the next 10 years you’d receive $1.375 every six months, and at the end the government would return $100 to you (in addition to the coupon payments), assuming the government doesn’t default on its debts. Neat!
Okay, so, we’re starting to get a grasp on what yield means, but we’ve only discussed bonds that are purchased from their date of issue. How do you figure out the yield of, say, a 10 year bond that someone bought 5 years ago? Well, that math is a bit more tricky. That value is known as yield to maturity, which is generally what people are referring to when they talk about “bond yields”.
Calculating the yield to maturity is a bit more complex. The reason it’s tricky is that on open markets, the bonds being bought and sold have different maturities, so you have to calculate the yields on a case by case basis, which is pretty easy for computers but a bit tricky for humans. If you want to determine the yield, you would look at the current market price for a bond, and work backwards to determine the yield. That looks like this (assuming we know the current market price, \(V_{present}\)):
$$ Y_{maturity} = \dfrac{C_{rate} + \dfrac{V_{face} - V_{present}}{n_{periods}}}{\dfrac{V_{face} + V_{present}}{2}} $$
Where \(C_{rate}\) is the coupon rate (i.e., the face value yield on the bond). \(n_{periods}\) can be anywhere between 20 and 1 (in the case of 10 year notes).
The equation above might look complicated, but it’s actually quite simple: you take the coupon rate, add the difference between the face and present value, and divide that by the mean of the face and present value. It’s the same as the simple form (\(Y = \dfrac{C}{P}\)) except that we account for the difference between the market price and the face value.
The math can get a bit more complicated if you want to, say, become a market maker, but in general it’s not all that complicated. Prices on the open market are set by buyers and sellers, and they can fluctuate quite a bit day to day, especially when political or economic events happen.
The Yield Curve: Why Does It Invert? #
The yield curve is what you get when you plot the difference in yield of one bond versus another. As I mentioned, the 10 year minus the 2 year treasury bond is one of the most often cited yield curve, and it’s popular because some people believe this to be a predictor of recessions.
When people talk about “yield inversion”, they simply mean that the 2 year has become more valuable in terms of yield than the 10 year. How does this happen? Well, it’s simple: during normal economic conditions, investors demand higher returns for locking up their money for longer periods. But when markets anticipate economic trouble ahead, they may prefer the safety of longer-term bonds, driving up their prices and pushing down their yields. At the same time, if investors expect interest rate cuts in response to economic weakness, short-term bonds become less attractive, as they’ll need to be reinvested at lower rates in the future.
Is an Inverted Yield Curve a Recession Predictor? #
Not really, at least not in the simple way people often imply. By the time the yield curve has inverted, the market is past the point of predicting a future recession, and it’s now signaling that the central bank will likely adjust rates in the future.
If the 2 year has a higher yield than the 10 year, that means the market believes that interest rates will go down within the next 2 years or so. In other words, a 2 year bond right now is more valuable than a 10 year bond, because interest rates will be lower than the current yields in the future.
The current federal funds rate is 3-3.25%, but the yield on the 2 year is 4.554% as of today. So what the bond market is telling you is that it expects interest rates to come down from their current point within 2 years.
A few things make the signal messier than it first appears:
- Yields aren’t determined by recessions alone, they’re determined by central bank policies which incorporate many economic factors.
- Markets price in expectations quickly. Since prices come from participants rather than any central authority, an inversion usually means traders are reacting to information that’s already out there.
- While yield curve inversion has historically preceded recessions, it mostly reflects expectations about slower growth and future rate cuts, and the time between inversion and recession can vary significantly.
Are We in a Recession? Is a Recession Coming? #
The 10 minus 2 yield inversion has historically been brief, and often precedes a recession. Whether or not we’re currently in a recession is still being debated, but we’ve had negative GDP growth for a while now.
Here’s what the yield curve looks like going back to 1976:
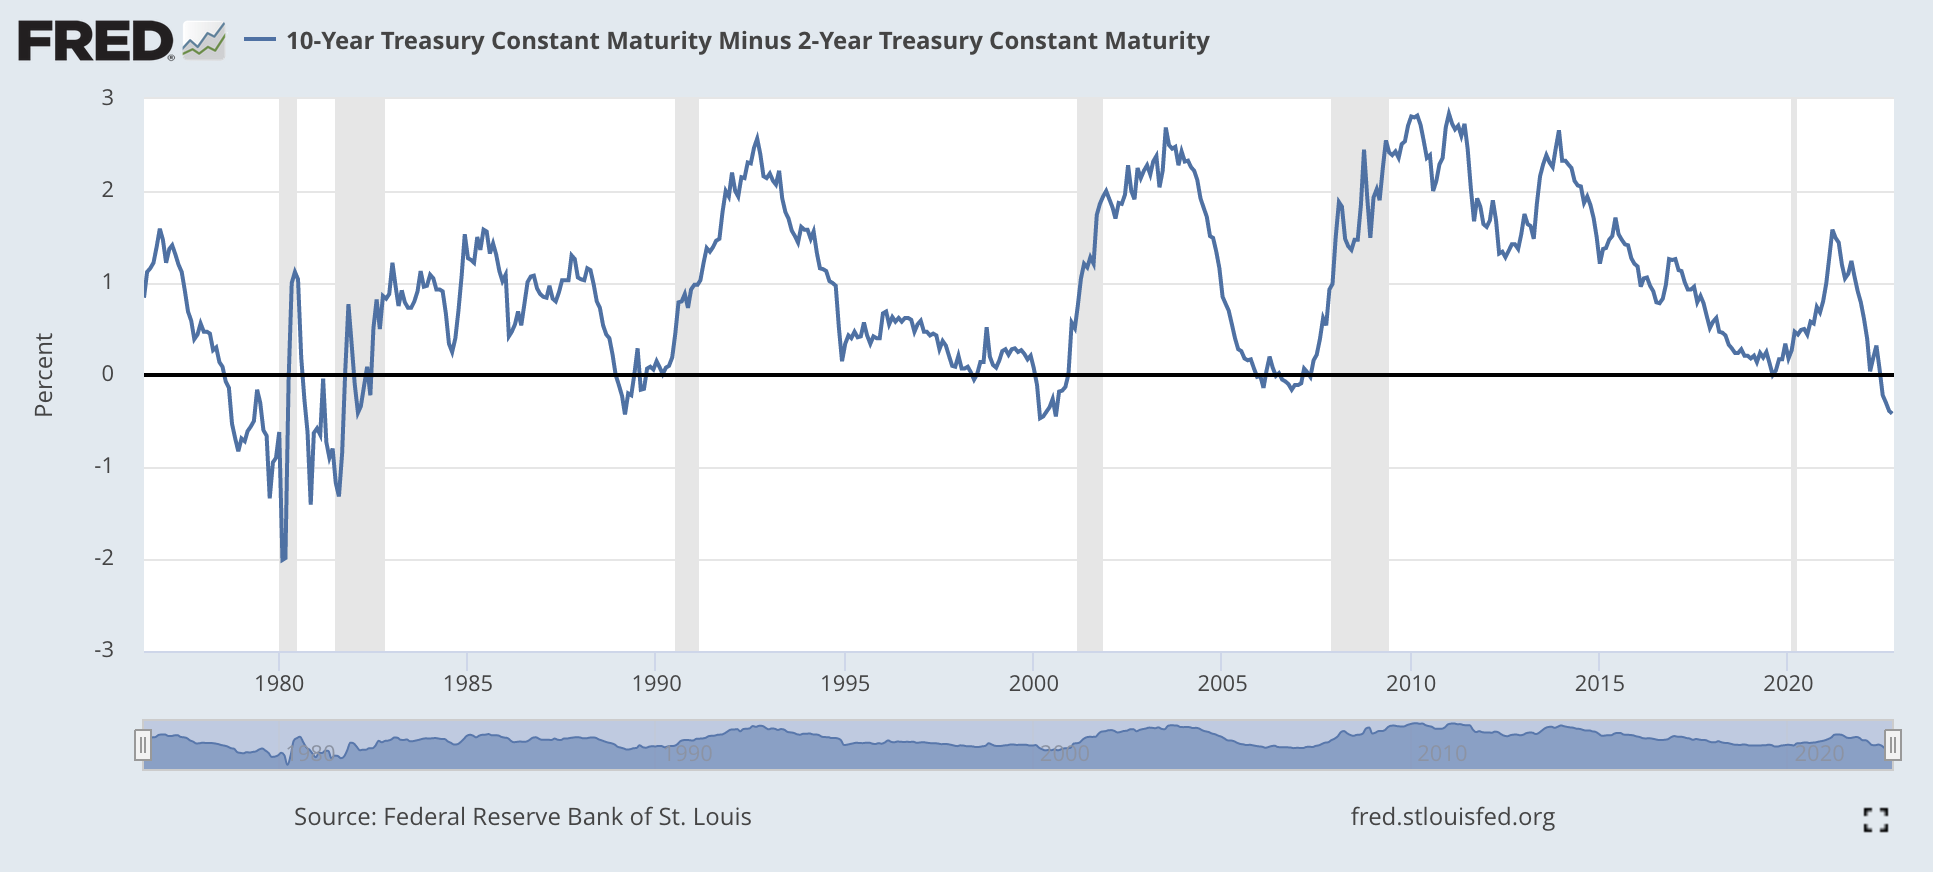
The grey vertical areas in the chart above are periods officially denoted as recessions, and as you can see around 1980, 1990, 2003, 2008, right before 2020, and of course now, the yield curve was inverted.
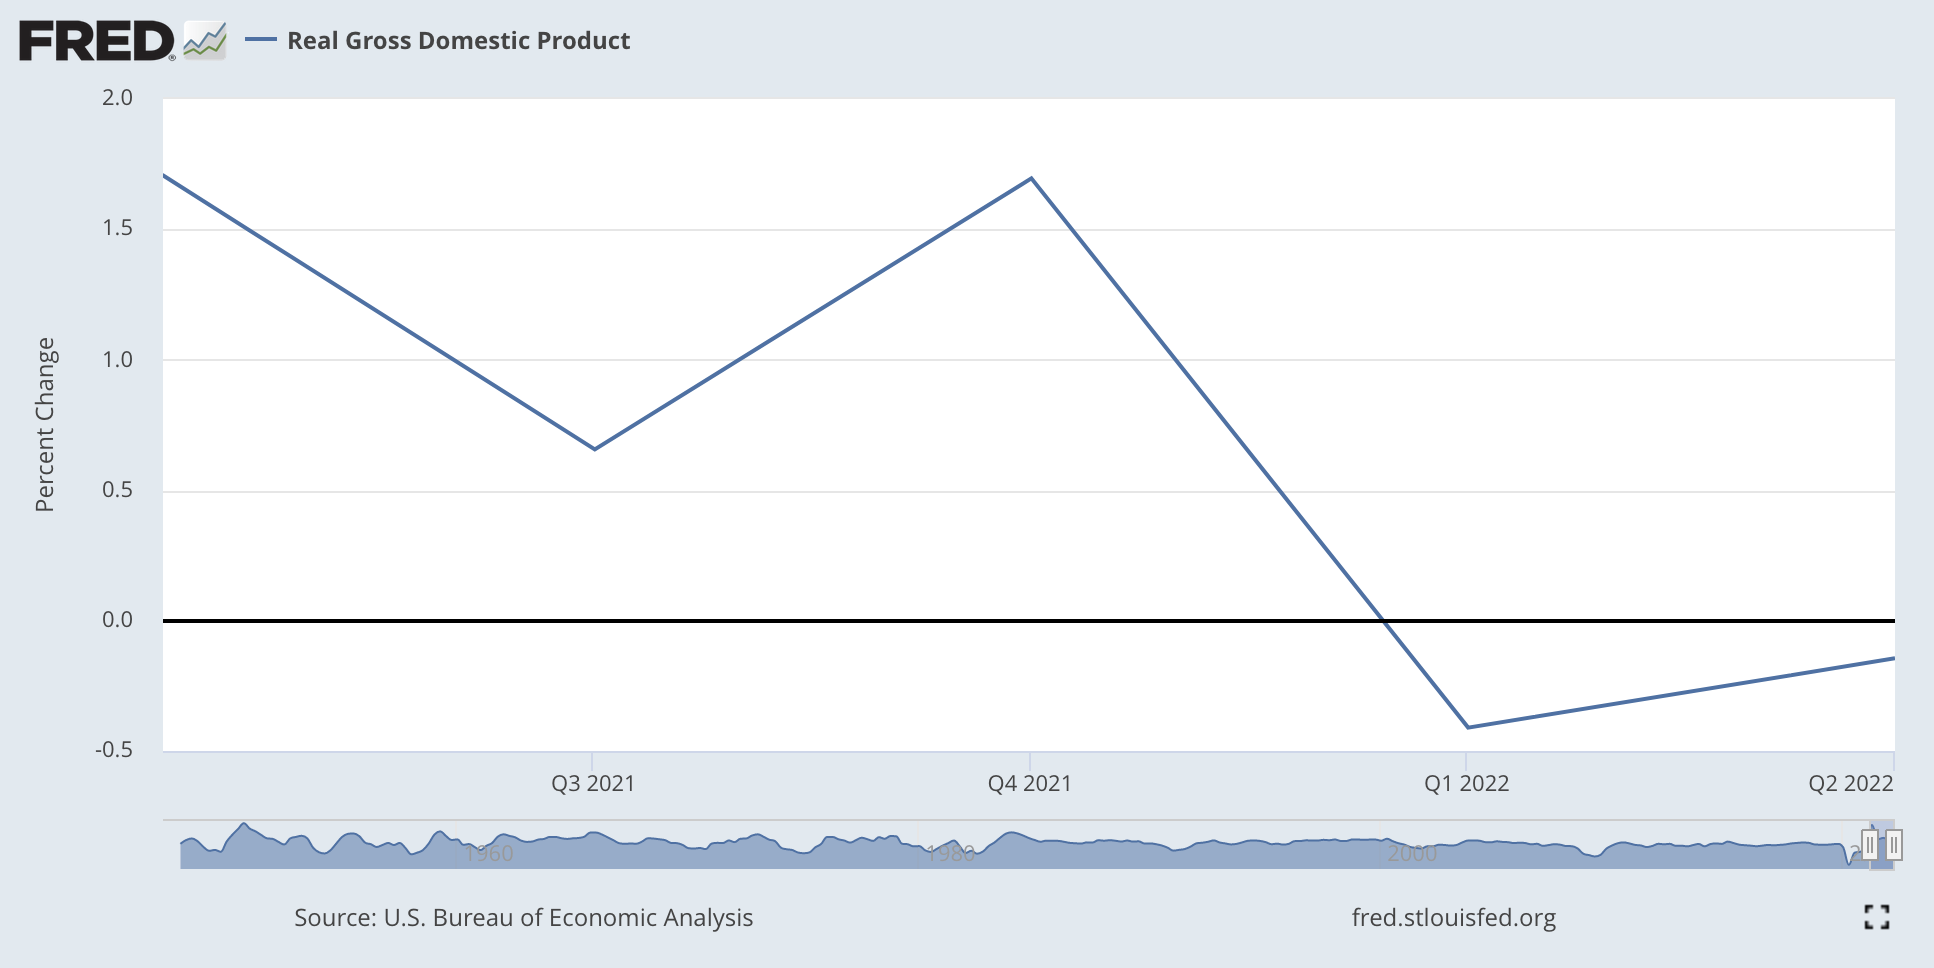
And our real GDP measured as a percentage changed since the previous quarter has been ever so slightly negative the last 2 quarters:
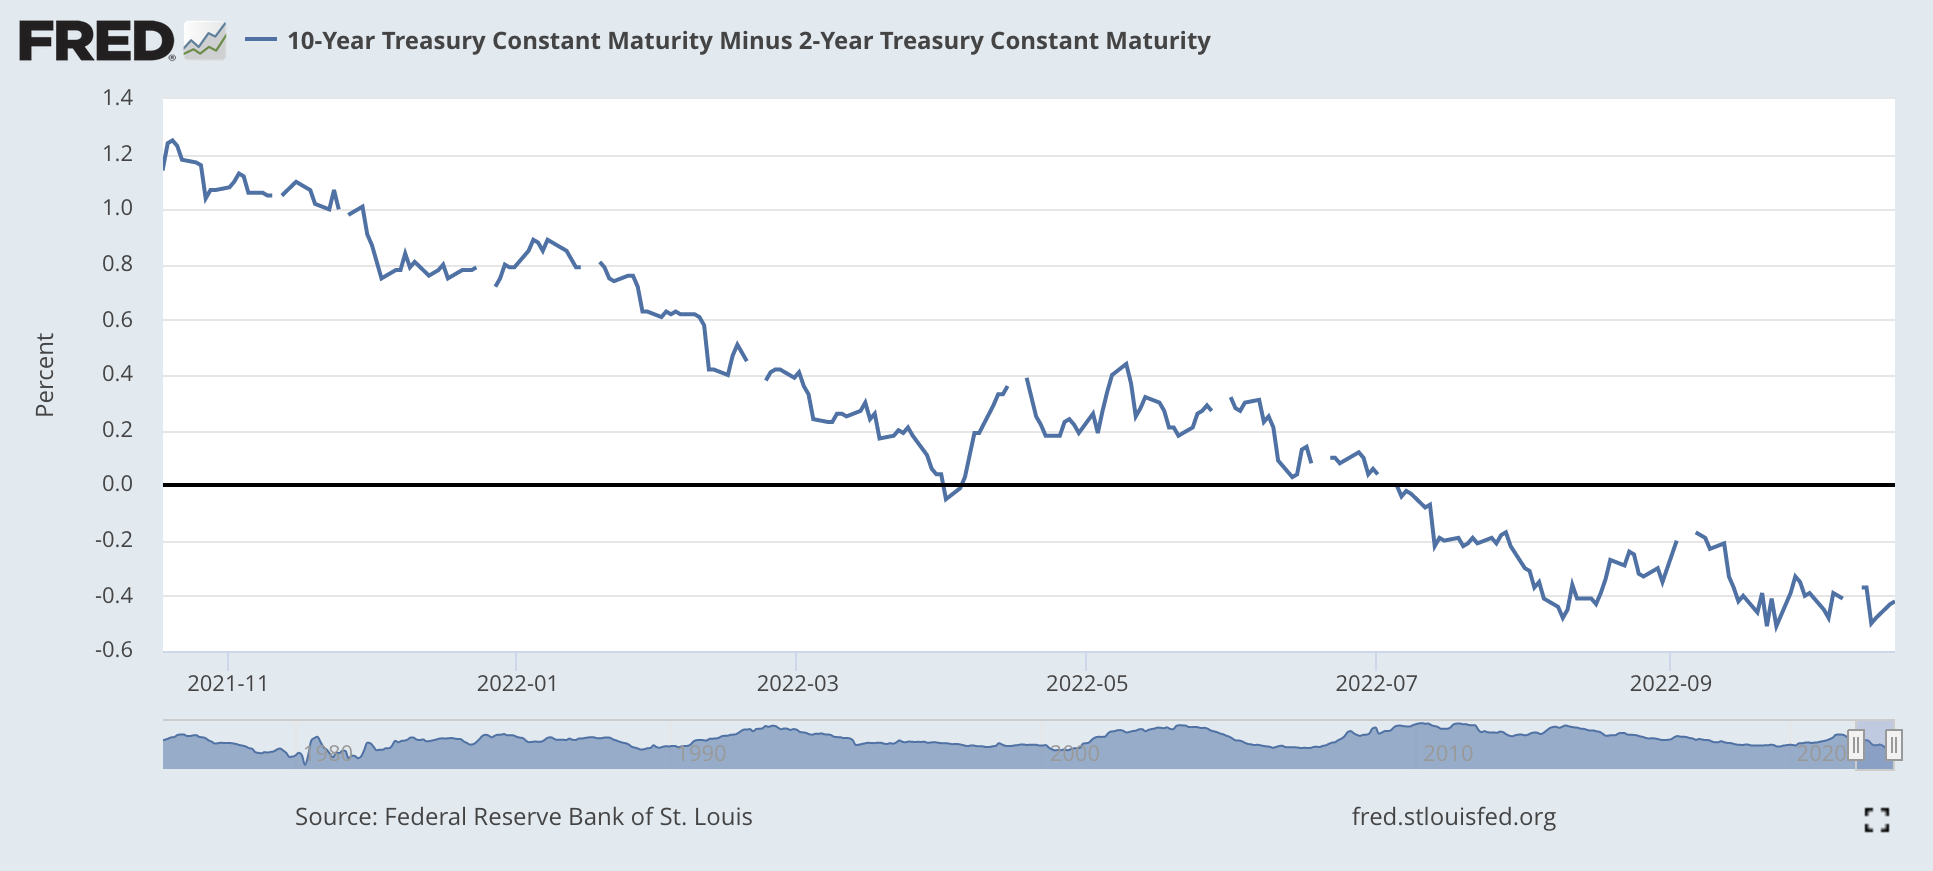
We can also zoom in a bit on the yield curve and see how it lines up with the GDP data, which had negative real growth in Q1 of 2022:
You can reasonably argue that:
- We’re likely experiencing economic contraction.
- The yield curve is telling us that the Federal Reserve may need to at the very least pause on raising rates, and possibly even adjust rates in the future.
Whether we’re “in a recession” depends on which definition you care about, but if we go by the common definition of “2 consecutive quarters of negative real growth” (which is widely accepted), then the data suggests we may be in a technical recession.
What This Means for Investors #
As I mentioned, markets are always forward looking, and right now the bond market believes we’re headed for challenging economic times, and the central bank will likely need to respond by adjusting monetary policy. The Federal Reserve, on the other hand, has maintained it’s focused on getting inflation down. In other words, there’s currently a tension between market expectations and central bank policy.
Bond traders aren’t omniscient, but they’re clearly pricing in weaker growth and lower rates down the line. As the saying goes, “markets can stay irrational longer than you can remain solvent.”
With yields this high, bonds are at least worth a harder look than they were a year ago. Whether that matters to you mostly comes down to how long you can afford to hold them.
For those interested in learning more about bond investing, FINRA offers helpful educational resources aimed at retail investors.